One of the things I’ve been playing around with over the last few months is the NBER Patent dataset. This provides a listing of all US patents from 1963-1999 together with a full set of citations for patents in the period 1975-1999.
As it is an open dataset you’re able to get it and use it without seeking special permission, filling in forms or paying any money (so an especially big thank-you though to Hall, Jaffe and Trajtenberg who created it).
First step was loading the data into a postgres database using some python and SQLAlchemy. This was not as trivial as it should have been as some data cleaning was needed (a few duplicate patents and citations, citations with missing patents etc) but once it was done I had a nice multi-GB db with approx 2 million patents and 16 million citations in it (on my machine, the full load, once properly coded, took around an hour).
Next step was the analysis. I’ve done a variety of things, but what I describe here are the efforts to visualize ‘knowledge flows’ between different technology areas. In essence each patent is given a classificatory technological ‘class’ (there is some ambiguity about exactly how a class relates to the actual technology in the patent but we will ignore that here). In the NBER data there are over 400 of these.
This turned out to be rather too many to conveniently visualize so instead we use groupings of these classes termed ‘subcategories’ (or just subcats) in the NBER dataset. There are 36 of these subcats. We’re interested in calculating and visualizing ‘technology (or knowledge) flows’ between different technological subcategories.
Of course we don’t directly observe knowledge flows: all we observe are citations. Thus, here what we are calculating and showing are citation flows – which one can imagine provide some approximation of the underlying technology/knowledge flows. Specifically, for a given year we go through all the patents in a given year and look at its citations. For each such citation we add 1/N to the flow from category i to category j where the patent is in category j, the cited patent is in category i and N is the total number of citations that patent has (the reversal of i and j is because a cite i -> j corresponds to a flow j -> i)
The result of this is a flow matrix which we can then plot using standard tools (networkx and graphviz to be precise). Here are some of the results:
The Diagrams
- Size of nodes indicates total citation flows from that area in that year
- Yellow portion is citations back into that subcategory while black represents portion that is into other subcategories (comparison by area).
- Direction of flow is indicated by an arrow head (a rectangular block) with size of flow measured by width of edge and size of head.
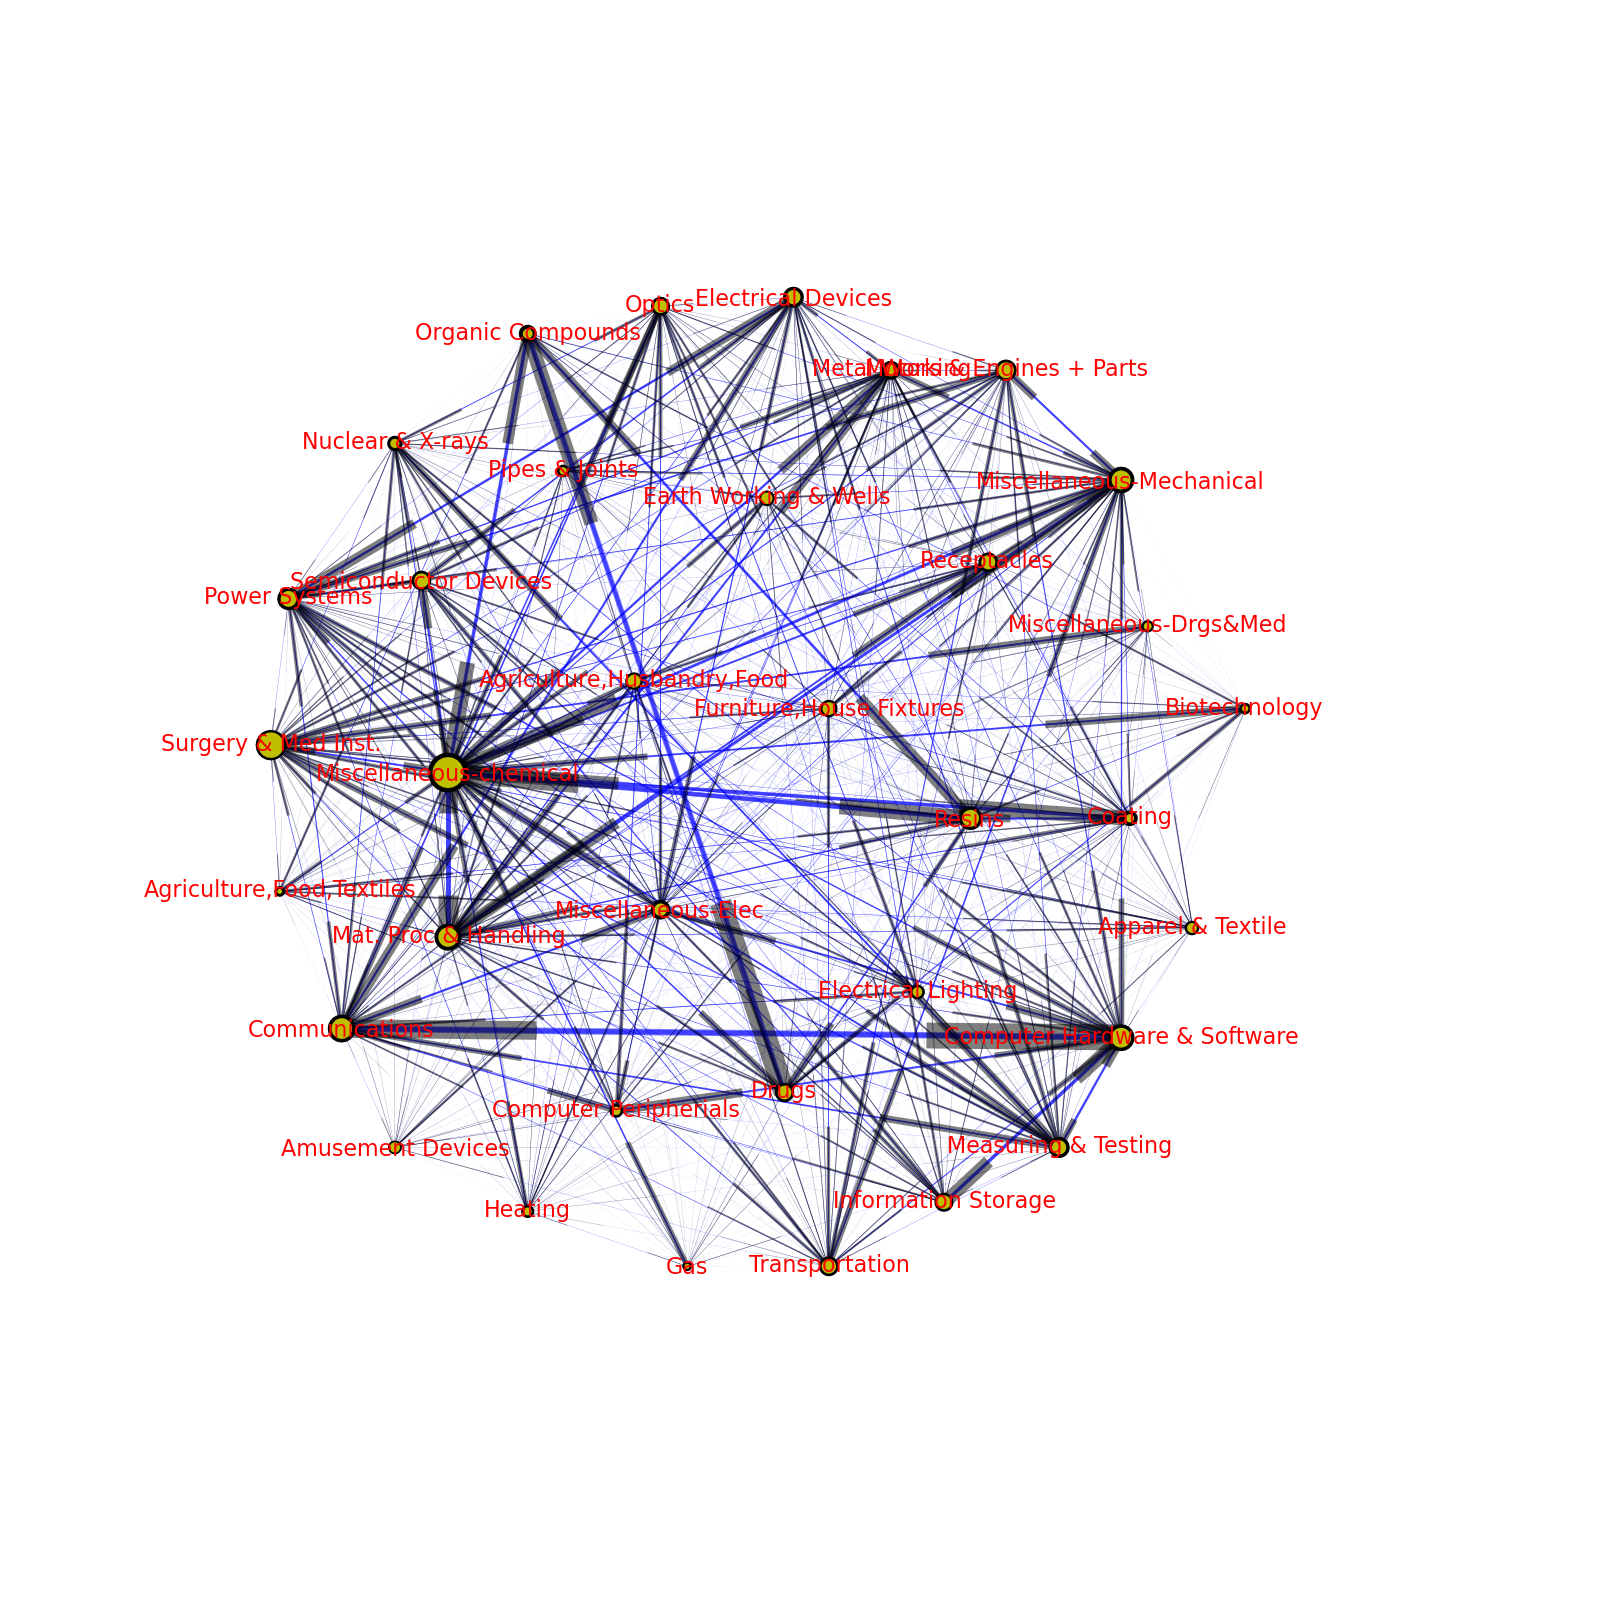
All Citations Flows (1994 Patents) (click through for full-size ~ 1.5MB)
This figure is only shown at a very low resolution in order to keep the image size down. As is to be expected, most categories have some level flow to most other categories, and so the image is very busy. In addition the resulting (automated) node layout does not do a great job of clustering items (it is based on the simple adjacency matrix which ignore flow sizes and what we have here, approxiimately, is the complete graph).
To address this a threshold approach was used whereby all flows below a threshold were discarded. This threshold was set equal to a percentage of the total flows of that category in that period – so it varied across categories (experimentation indicated that 5% was a good cut-off to use). Here’s the results:
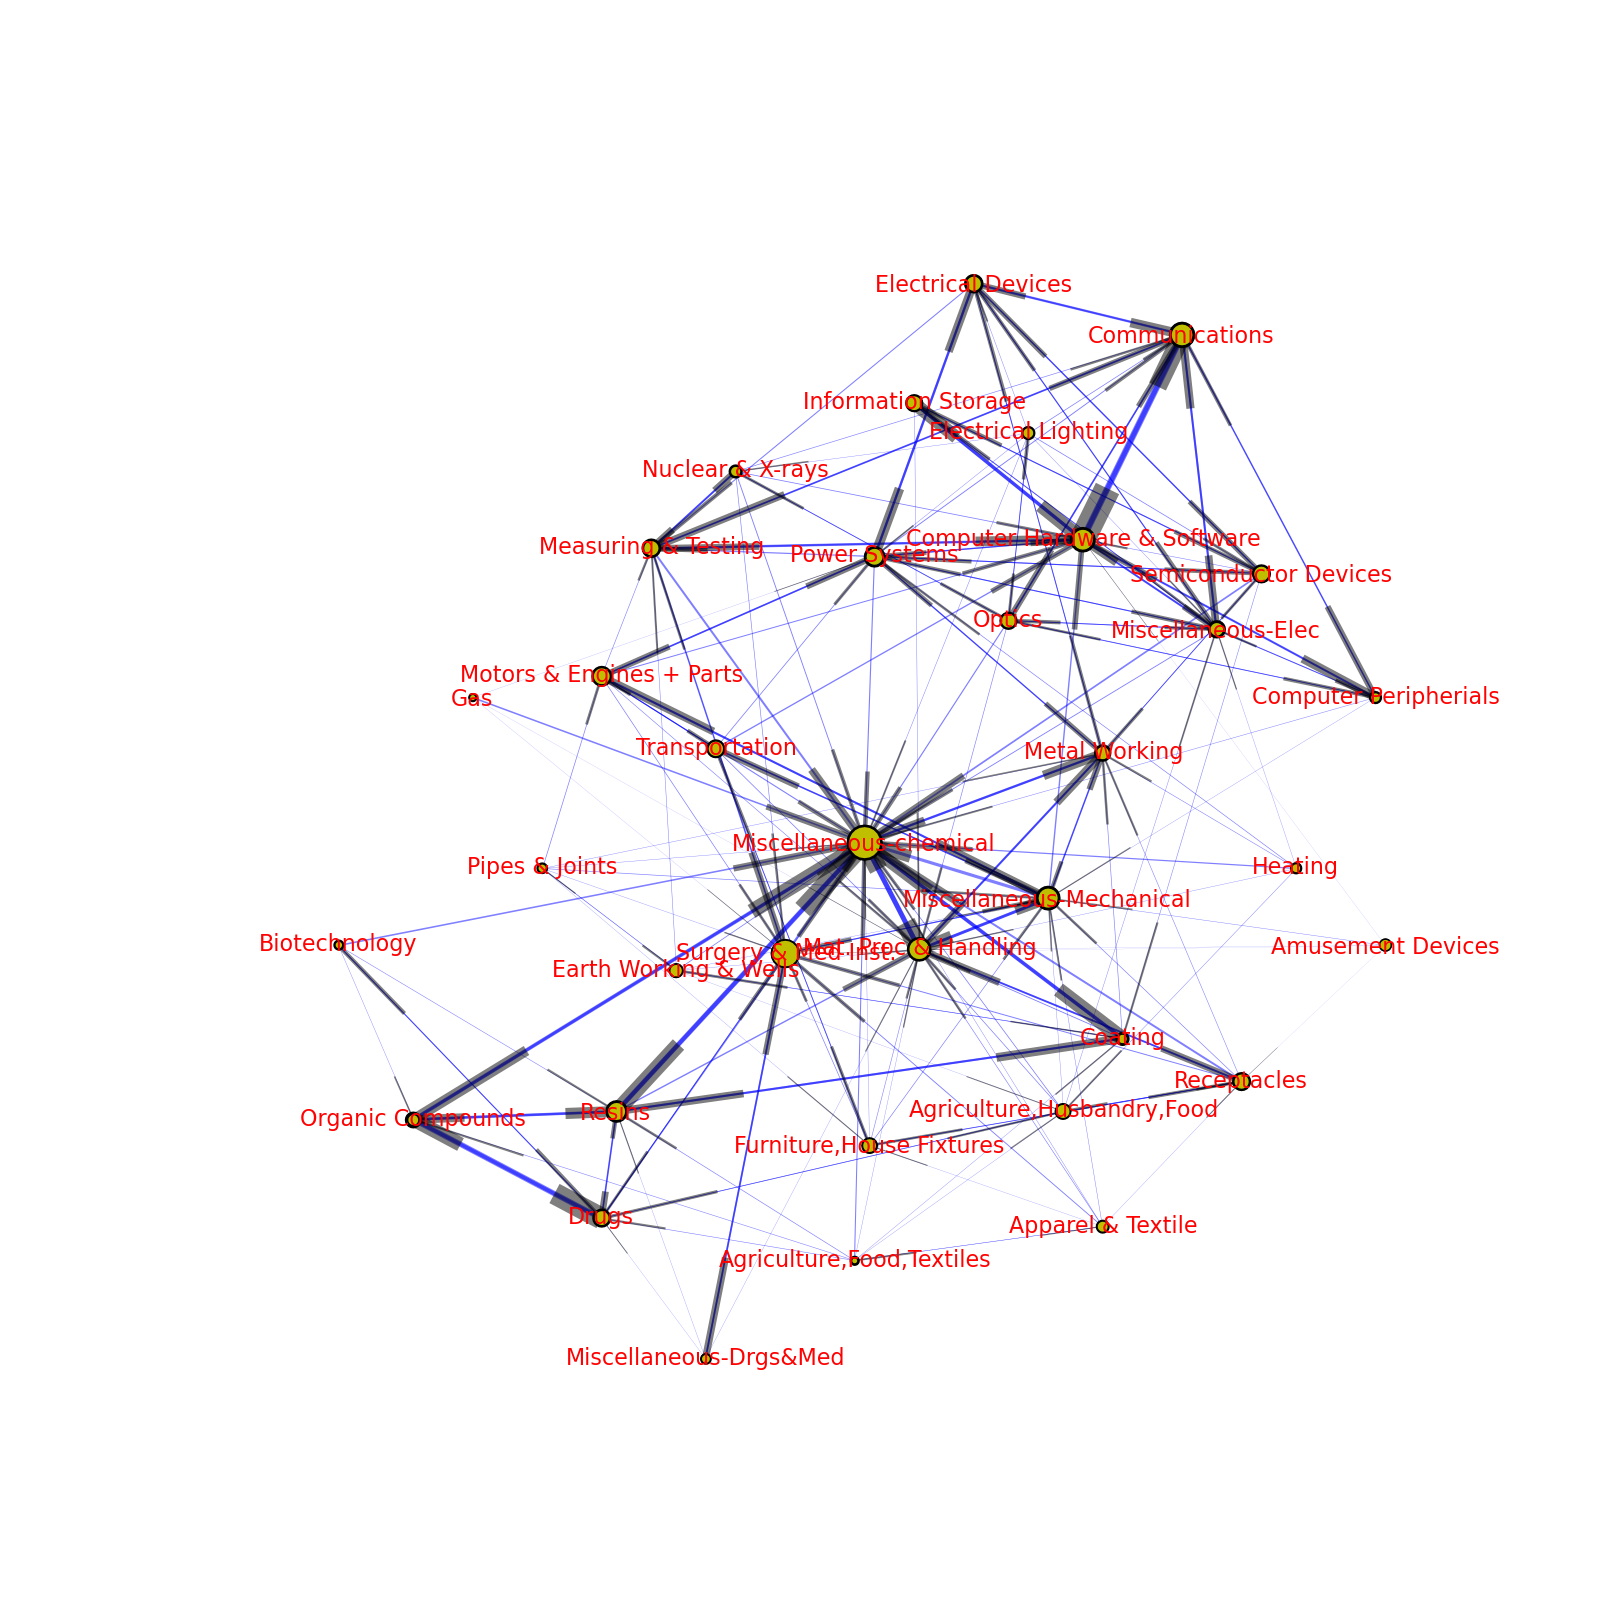
Citation Flows (1994 Patents) Above Threshold (click through for full size ~ 0.6 MB)
As you can see we now have a lot more structure coming through in the layout as well as a much cleaner visualization. In particular, two distinct groupings emerge: a ‘chemical’ one in the centre of the picture focused on the ‘Miscellaneous Chemical’ category and a second ‘Computing/Electronics’ in the top right focused on the ‘Computer Hardware and Software’ category.
One can also see natural bridging groups, for example various (high-tech) mechanical and measuring categories in the middle-to-top left which connect to both the computer group and the chemical group.
The next step is to watch how these flows, and the relationships implied by them, have evolved over time. We can do this by plotting the same graph say, every 3 years, from 1975 up until the present. However, as this is already a fairly long post and the images are fairly large this will left for a follow-up article.
Sources: NBER data is available from the link given above. The code used to do the analysis and produce the images is not yet available online somewhere as it isn’t yet packaged up into a ‘nice’ form. However, if anyone wanted it I’d be more than happy to share it under an open licence so just let me know.